
Reporting
Statistics to get the most out of your events
Statistics are an important tool for assessing the success of the entire event, as well as individual measures. Only with meaningful statistics can individual measures be optimized and contribute to the success of the event.
Our dashboard, the statistics of the individual modules and your individual reports provide important insights to understand your target audience, tailor your communication and implement successful events.
The dashboard - the big picture at a glance
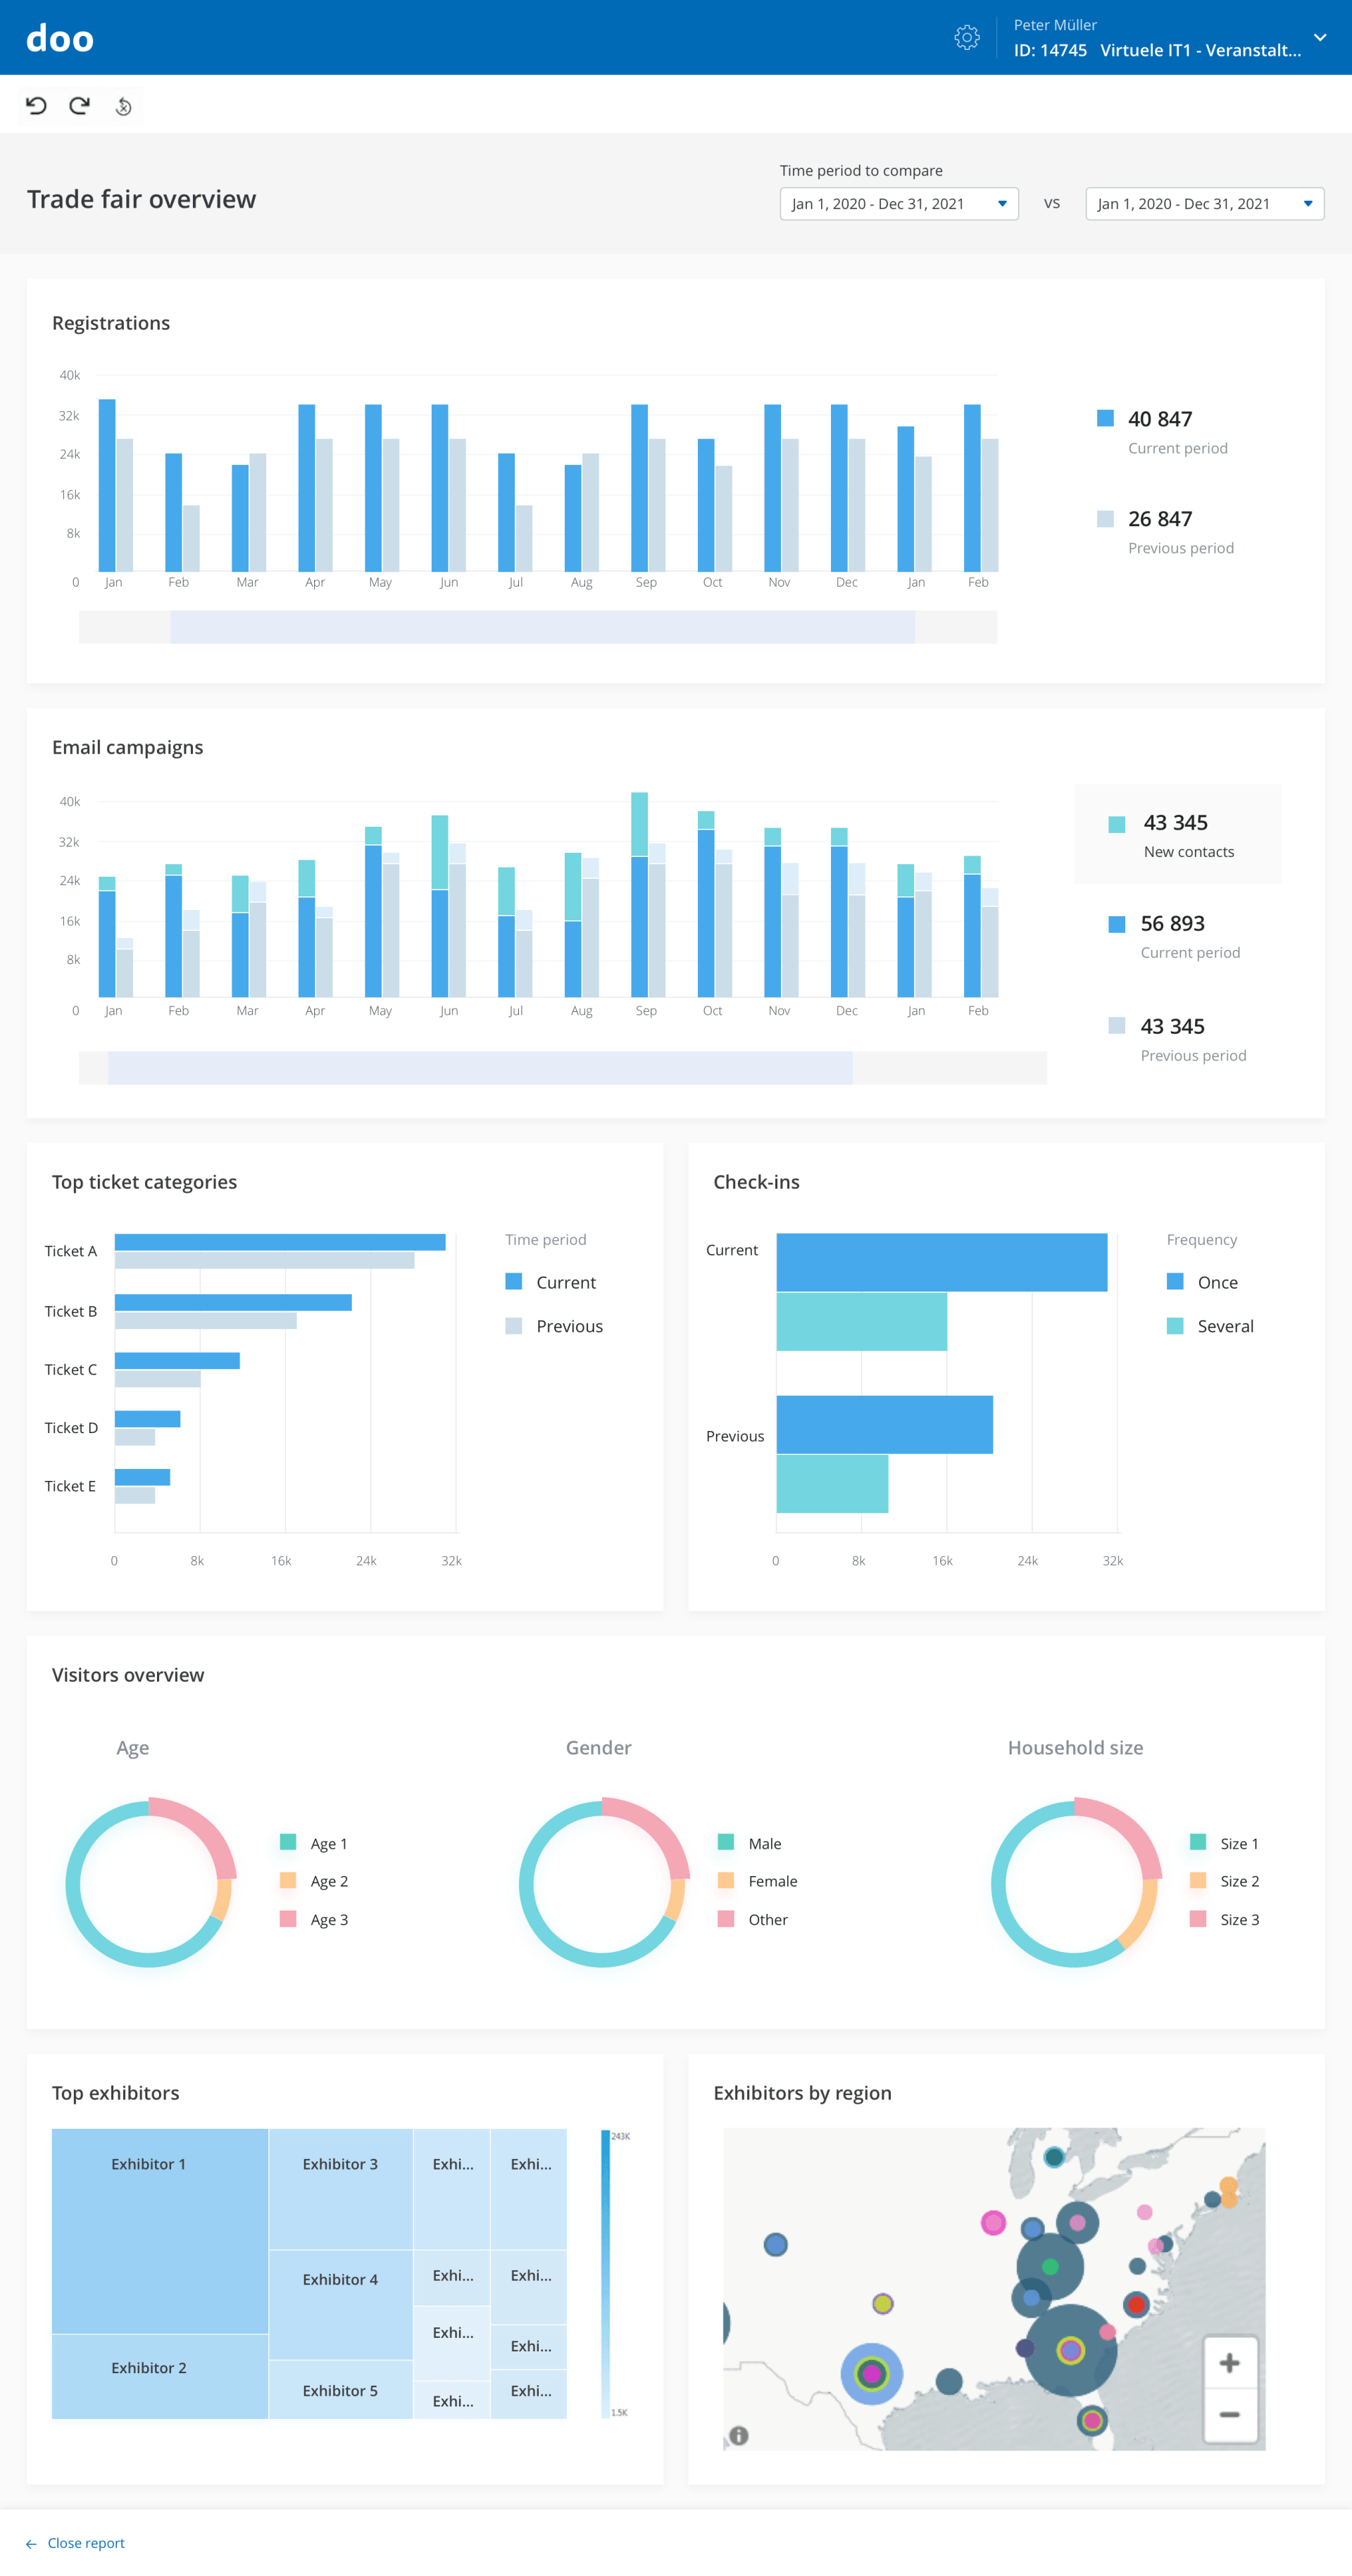
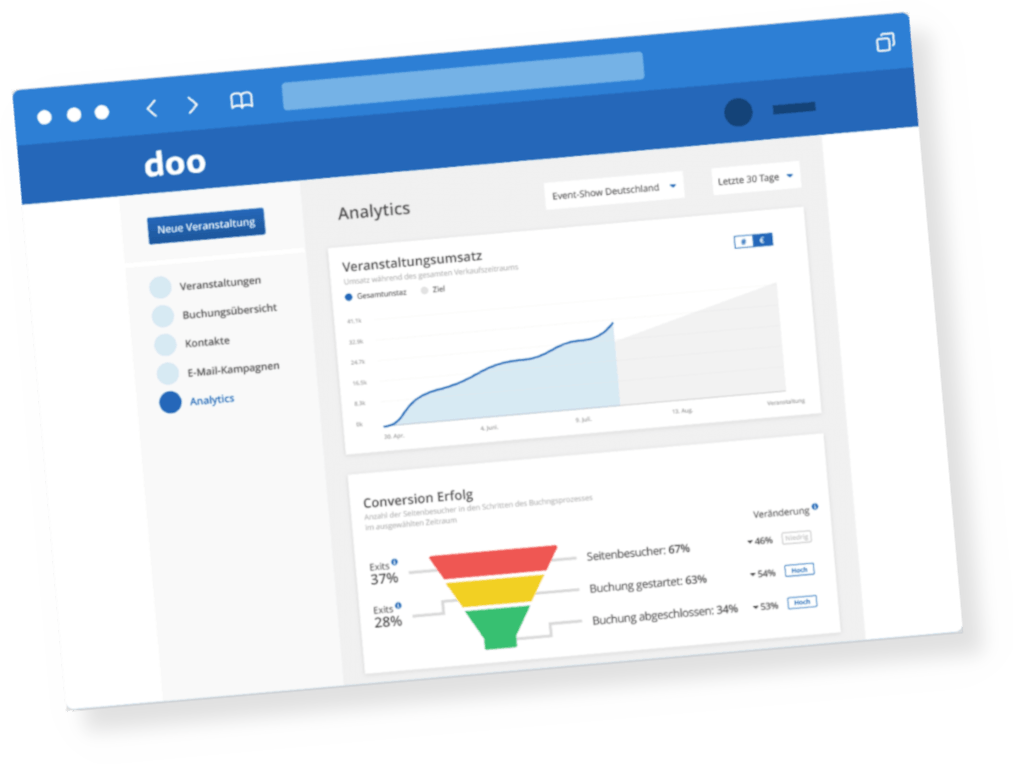
The dashboard provides you with a single view of all your events' key metrics. Which events have already been created, and what is the booking status for each event? Which emails have already been sent, to how many contacts, and what is the open rate of each email? How many new contacts are in the database, and, most importantly, what revenue have you generated through bookings?
Detailed statistics for each module
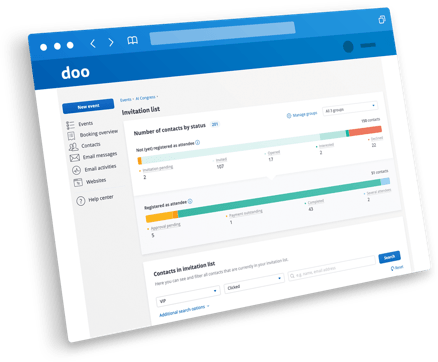
In addition to the overarching dashboard, you have access to numerous detailed statistics for each module. For example, the success report for your email campaigns provides you with a detailed insight into the success of each individual mailing. For your events, you can see at a glance how many participants have registered. You can see not only which ticket categories and additional products have been booked and how often, but also whether the respective maximum capacity has already been reached.
Individual, comprehensive reports
There's a dedicated area for individual and cross-module reports. Additional reports tailored to your goals and KPIs can be stored here. Whether you want to keep track of your event's carbon footprint or know where your attendees come from each day, the possibilities for gaining insights from your data are virtually limitless.
Guy Hawkins
President of Sales

Guy Hawkins
President of Sales

Guy Hawkins
President of Sales

Guy Hawkins
President of Sales

Guy Hawkins
President of Sales

Guy Hawkins
President of Sales

Guy Hawkins
President of Sales

Guy Hawkins
President of Sales

Guy Hawkins
President of Sales
Guy Hawkins
President of Sales
Guy Hawkins
President of Sales
Guy Hawkins
President of Sales
Guy Hawkins
President of Sales
Guy Hawkins
President of Sales